Physical Address
60 Ekwema Cres, Layout 460281, Imo
Physical Address
60 Ekwema Cres, Layout 460281, Imo

In the modern digital landscape, businesses heavily depend on web applications to serve and meet customer needs. To ensure optimal performance and continuous availability, synthetic monitoring plays a crucial role. New Relic, a prominent Application Performance Monitoring (APM) tool, provides a robust solution called Synthetics Monitoring.

Synthetics Monitoring is crafted to replicate user interactions and behaviors, enabling organizations to monitor web applications, APIs, and critical transactions globally. Through proactive execution of synthetic tests, businesses can pinpoint potential performance bottlenecks, latency issues, and downtime scenarios before affecting real users.

In the dynamic digital landscape, even a minor delay in application response times can result in customer dissatisfaction and revenue loss. Synthetics Monitoring tackles this challenge by consistently testing and evaluating application performance, aiding organizations in sustaining a high level of reliability and availability.
Moreover, Synthetics Monitoring is pivotal in evaluating the performance and functionality of APIs. Given that APIs serve as the backbone of contemporary web applications, monitoring their responsiveness and correctness is paramount.
Read Next: How to Start Mini Importation Business in Nigeria (From China, the UK, & Others)
To leverage Synthetics Monitoring, the initial step involves creating a New Relic account. If you haven’t registered yet, the sign-up process is swift and uncomplicated. Once you gain access to your New Relic dashboard, proceed to the Synthetics section.
Within the Synthetics section, a user-friendly interface facilitates efficient configuration and management of synthetic monitors. Here, you can establish new monitors, review existing ones, and analyze the data collected during tests.
When setting up synthetic monitors, the crucial aspect is selecting appropriate locations for test execution. Opt for locations that align geographically with your user base to capture performance data from their perspectives.
Moreover, carefully determine the frequency of synthetic tests. While frequent tests yield more data points, they might also impose an excessive load on your application. Striking the right balance is paramount for acquiring meaningful and actionable insights.
New Relic provides a variety of monitor types catering to diverse monitoring requirements:
Choosing the suitable monitor types allows you to concentrate on monitoring specific facets of your application’s performance.
Establishing alert conditions is crucial for prompt incident response. When your application’s performance deviates from the anticipated baseline, alert conditions initiate notifications to designated team members.
Carefully define alert thresholds to prevent unnecessary alerts while guaranteeing swift attention to critical issues. Fine-tune alert sensitivity based on your application’s typical performance patterns for optimal responsiveness.
The heart of Synthetics Monitoring lies in the synthetic scripts. These scripts define the steps the synthetic monitor should take during the test. Crafting accurate and realistic scripts is crucial for meaningful test results.
To create effective scripts, you must understand how users interact with your application and what scenarios are critical to test. Regularly update and optimize scripts to reflect changes in your application’s user experience.
A key use case for Synthetics Monitoring is verifying the availability and responsiveness of your website. Regular ping tests or HTTP request checks ensure uninterrupted user access to your services.
Monitoring response times aids in detecting potential latency issues impacting the user experience. Insight into your application’s behavior across diverse locations and under varying loads is crucial for delivering consistent and reliable service.
Contemporary web applications frequently entail multi-step user interactions, including logging in, navigating complex workflows, or completing transactions. Synthetics can replicate these interactions through scripted browser tests.
Establishing multi-step synthetic tests enables monitoring of vital user flows and identifying potential bottlenecks or errors. This optimization process enhances the user experience and contributes to improved conversion rates.
Read More: Amazon Echo: Leading the Way Ahead of other Smart Speakers
In applications heavily dependent on APIs, monitoring API performance is crucial. Synthetics Monitoring enables the validation of API endpoints, ensuring they align with your response time expectations.
Through monitoring API performance, you gain insights into your application’s interaction with external services and can identify issues stemming from API latency or functionality.
Post-running synthetic tests over time accumulate substantial performance data. Analyzing this data aids in pinpointing performance bottlenecks, including slow-loading pages, inefficient database queries, or dependencies on third-party services.
Recognition of these bottlenecks facilitates prioritizing optimizations and effective resource allocation.
Synthetics tests may intermittently uncover errors or failures. In such instances, prompt investigation of the root cause is crucial.
Analyzing test results, logs, and error messages allows you to discern whether the issue resides in your application code, server configurations, or external dependencies.
For a comprehensive grasp of your application’s performance, compare historical data across different periods. Analyzing trends over time facilitates the identification of gradual performance degradation or improvements.
This information proves valuable for capacity planning, enabling anticipation of resource needs during peak periods.
New Relic provides a cohesive ecosystem of tools that complement each other. Integrating Synthetics Monitoring with New Relic’s APM and Insights features offers a comprehensive view of your application’s health and performance.
Application Performance Monitoring (APM) provides in-depth insights into your application’s performance, particularly at the code level. By correlating APM metrics with Synthetics data, a comprehensive understanding emerges, revealing the direct impact of performance on end-user experiences. This synergy allows for targeted investigations, such as examining whether sluggish page loading is associated with specific backend processes or external API calls. In essence, APM and Synthetics form a powerful duo, offering a nuanced perspective on performance dynamics and their implications for user interactions.
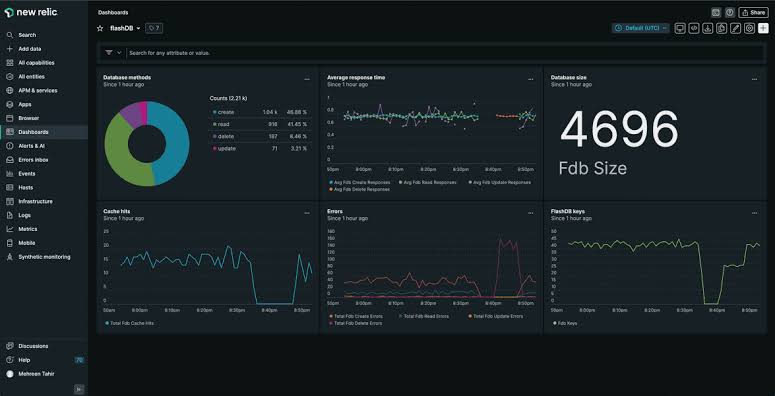
Custom dashboards and reports enable the visualization of performance data tailored to your organization’s unique needs. By customizing reports to your team’s requirements, you can efficiently share performance data and insights with stakeholders.
When selecting monitor locations, factor in your target audience and their geographic locations. Monitoring from relevant regions yields valuable data on how diverse user groups experience your application.
To gain accurate insights, create synthetic tests that accurately simulate real user behavior. Test scenarios should mirror actual user interactions to reflect the typical user experience.
Prevent “alert fatigue” by fine-tuning alert conditions to minimize false positives. Review historical performance data and set thresholds aligned with your application’s normal behavior. This mitigates unnecessary notifications while ensuring swift attention to critical issues.
Moreover, contemplate implementing intelligent alerting mechanisms that consider multiple performance metrics. For instance, configure alerts based on a combination of response time and error rate to capture complex performance issues effectively.
Synthetics Monitoring produces a wealth of performance data. Utilize this data for data-driven decision-making and the ongoing enhancement of your application’s performance.
Through the analysis of historical trends and patterns, pinpoint areas requiring optimization. Concentrate on critical aspects, like high-traffic pages or frequently used APIs, to maximize the impact of your performance improvements.
While conducting synthetic tests, you might encounter scenarios involving sensitive data. Therefore, ensure that your synthetic scripts are crafted to handle such information responsibly.
Prevent exposure of confidential data in synthetic tests; consider employing test accounts or anonymized data for simulating user interactions. This ensures data privacy and security while still extracting valuable performance insights.
Moreover, align your Synthetics Monitoring practices with data protection regulations. Be mindful of compliance requirements pertinent to your industry and region and take the necessary measures to remain compliant.
Read More: Top 21 Leading Tech Startups and Companies in Nigeria
Common challenges encountered in synthetics monitoring include:
False alerts can undermine trust in your monitoring system and consume valuable time. To minimize false positives, consistently review and fine-tune alert conditions in response to changing application behaviors.
In instances of false negatives where genuine issues go undetected, investigate the root cause. Adjust alert thresholds or broaden the scope of monitoring to encompass these events in the future.
Synthetics Monitoring offers valuable insights, but it’s crucial to acknowledge its limitations. Synthetic tests can simulate user behavior but may not precisely replicate real-world conditions.
To enhance synthetic monitoring, consider incorporating real-user monitoring (RUM) data. RUM provides real-time insights into how actual users experience your application, uncovering issues that synthetic tests might overlook.
When synthetic test data exhibits fluctuations, it’s crucial to investigate the underlying causes. Changes in application code, server configurations, or external service providers may contribute to these variations.
Examine the test environment and compare data from multiple monitoring sources to pinpoint the factors causing fluctuations. Take appropriate actions based on your findings.
As technology evolves, New Relic is likely to introduce new features and enhancements to its Synthetics Monitoring tool.
Stay updated on New Relic’s announcements for the latest advancements in synthetic monitoring. These may encompass more advanced scripting capabilities, expanded monitoring options, and enhanced integrations with other New Relic products.
In summary, Synthetics Monitoring in New Relic proves to be a robust tool for ensuring optimal performance in web applications and APIs. Through proactive monitoring, performance data analysis, and alert fine-tuning, businesses can identify and address potential issues before affecting real users.
Integrating Synthetics data with other New Relic features, like APM and Insights, offers a comprehensive view of application health, empowering teams with valuable insights for continuous improvement.
With Synthetics Monitoring, organizations can confidently deliver high-quality user experiences, enhance application performance, and stay ahead in today’s competitive digital landscape.
New Relic Synthetics Monitoring is a powerful tool enabling businesses to proactively monitor web applications, APIs, and critical transactions from various locations, ensuring optimal performance and user experience.
To access Synthetics in New Relic, you need a New Relic account. Sign up for an account, then navigate to the Synthetics section from the New Relic dashboard.
New Relic offers various monitor types, including ping tests, HTTP requests, and scripted browser tests, catering to different monitoring needs.
Yes, New Relic allows you to integrate Synthetics data with other features like APM and Insights, providing a holistic view of your application’s performance.
In order to maintain security during synthetic tests, it is crucial to avoid exposing sensitive data. Use test accounts or anonymized data to simulate user interactions responsibly.